
By Riaan de Villiers
In line with our non-racial constitution, South African voters are not identified by race or ethnicity, when they register or when they vote. As a result, we don’t really know how many members of particular racial or population groups vote for particular political parties.
Any estimates are unofficial – while it hasn’t said so, the DA’s claim that it has attracted about a million black votes in the local government elections is based on internal calculations, relating the elections results to its own internal polling. However, given our history of racial politics, this remains a relevant and tantalising issue.
(Interestingly, this is information we think we have until we realise that we don’t, and the whole debate about racially based support for various parties is largely based on often wildly inaccurate beliefs and generalisations.)
Enter Gareth van Onselen, political strategist, pollster and commentator extraordinaire. Using a complex method which relates demographic data to election results and other IEC data — which he says took months to develop — he claims to be able to determine party support by population group (or race) with a high degree of accuracy, give or take a few percentage points.
He has just run his model on the results of the local government elections, with fascinating results. They have appeared in a modest post on his X account, but have attracted growing attention from the mainstream media, notably the website The Common Sense, which has publicised and examined his figures from various angles.
Voter turnout
Van Onselen first provides estimates of turnout by population group, as follows:
Black (African): 10 738 355 votes; 47.54% of registered black voters
White: 2 175 065 votes; 70.74% of registered white voters
Coloured: 1 376 521 votes; 55.63% of registered Coloured voters
Indian/Asian: 386 878 votes; 58.62% of registered Indian/Asian voters
Other: 88 786 (42.69%)
These figures seem to confirm that a higher proportion of black voters stayed away from the polls – widely taken as an indication of disillusionment with the outcomes of democratic governance, and particularly with the ANC.
Racial vote share of various parties
He goes on to calculate the shares of the votes of the various population or race groups of each of the five top parties – the ANC, DA, ActionSA, MKP and EFF – in other words, which percentage of the total vote of a particular racial or population group went to a given party (see table 1).
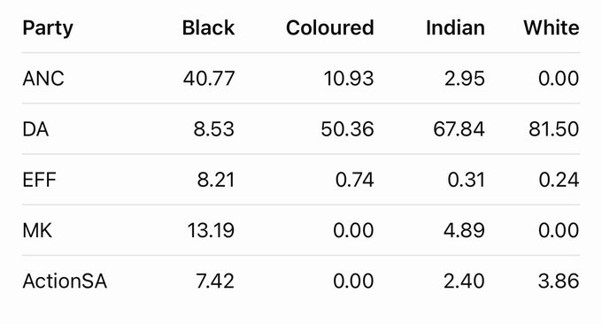
It shows that the ANC captured a meagre 40.77 of the black vote, followed by MK (13.19), the DA (8.53), the EFF (8.21) and ActionSA (7.2).
Its share of the coloured and Indian vote is very small, and the white vote almost non-existent (clearly, the double zero is a ‘systems’ anomaly). Put differently, very few whites voted for the ANC.
By contrast, the DA captured 50.36% of the coloured vote, 67.84% of the Indian vote, and 81.5% of the white vote, which are truly remarkable figures.
The actual numbers
Van Onselen then goes on to turn this into actual numbers (see table 2).
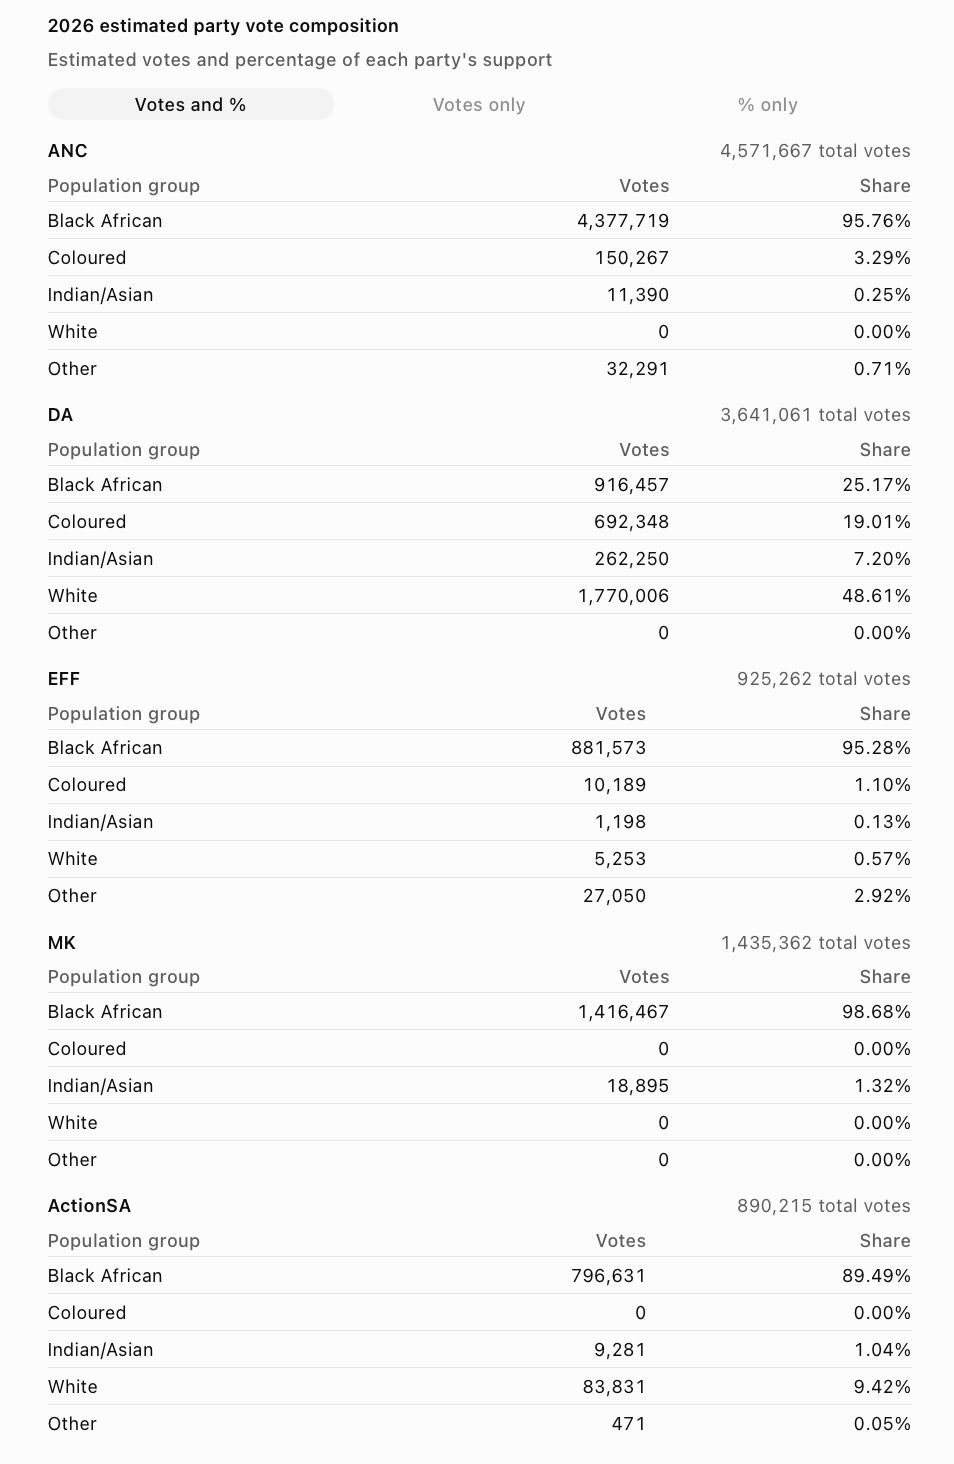
It shows that the ANC attracted 4.3 million black voters (97% of its vote), followed by MK at 1.4 million (99%), the DA at 916 000 (25%), the EFF at 881 000 (95%) and ActionSA at 796 000 (90%). (This shows, incidentally, that the DA’s claim of a million black votes was probably on the generous side.)
Forty-nine per cent of DA support came from white voters, 25% from black voters, 19% from coloured voters, and 7% from Indian voters.
As Van Onselen notes, all other parties are ‘essentially racially homogenous’. (ActionSA did have a far larger share of white voters in 2021, but this support has collapsed by more than half.)
Indeed, according to him, the ‘standout outcome’ of the election is the growth of the DA and ActionSA among black voters. The DA is now the third biggest party in this regard – significantly, even bigger than the EFF. Put differently, more blacks voted for the DA than for the EFF.
Vitally, Van Onselen notes: ‘It is also by some considerable distance the most diverse party, the other four parties being essentially racially homogenous in terms of support.’
So what does this all mean?
Obviously, one can spend a long time poring over these figures, and draw many more conclusions. My own takeaway is as follows:
Clearly, the DA’s black vote — little short of a million, and more than half its white vote – is a significant achievement, attesting to systematic campaigning over a number of years, which the media have largely and blithely ignored. (Indeed, while Van Onselen does not refer to this, the DA was the only party with a candidate in every single ward in the country.)
At the same time, in numerical terms, this is a long way off the ANC’s 4,3 million, an even longer way off the 6,6 million of the three monolithic black parties (or ‘charter’ parties, a new term coined by journalists writing about the coalition negotiations), and a very long way off the 7,4 million if ActionSA’s black vote is added. And, as noted previously, just 8,5 per cent of the total.
Among other things, this seems to deflate any expectations of the DA becoming a majority party any time soon, and underscores that the ANC (and its monolithic offshoots – the ANC’s ‘children’, in Julius Malema’s parlance) ) will remain a force in our politics for the foreseeable future.
Given all of this, one has to listen quite closely to what the politicians have to say. For instance, when DA leader Geordin Hill-Lewis addressed reporters in the IEC’s results centre, he told them the DA’s mission was to become the ‘largest party’ in South Africa, with no reference to any goal – however distant — of governing on its own, suggesting instead that the party will seek to maximise its position and role in an ongoing coalition landscape.
///////////////////////